 Blog Virtualizacion Tu Blog de Virtualización en Español. Maquinas Virtuales (El Blog de Negu) en castellano. Blog informática vExpert Raul Unzue

Artículos relacionados
Curso ELK: Cómo en Enviar Logs de NGINX desde un contenedor LXC a ELK
Seguimos con el curso de ElasticSearch…
Voy a utilizar para esta entrada un servidor NGINX corriendo en un contenedor LXC, pero sirve de base para otros servidores. Vamos a integrar sus logs en el stack ELK que está en otro punto de la red. Usaremos en este caso Filebeat.
Lo que vamos a conseguir es:
-
Leer los logs de acceso y error de NGINX dentro del LXC.
-
Enviarlos a Elasticsearch (o Logstash)
Pasos para configurar Filebeat
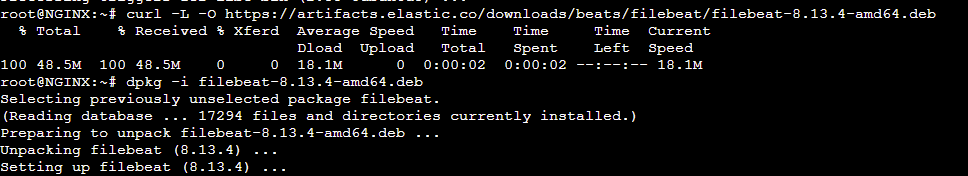
Si vuestro contenedor es Debian o Ubuntu, como es mi caso, lanzamos la instalación:
|
1 2 |
curl -L -O https://artifacts.elastic.co/downloads/beats/filebeat/filebeat-8.13.4-amd64.deb sudo dpkg -i filebeat-8.13.4-amd64.deb |
Habilitamos el módulo de NGINX:
|
1 2 |
root@NGINX:~# filebeat modules enable nginx Enabled nginx |
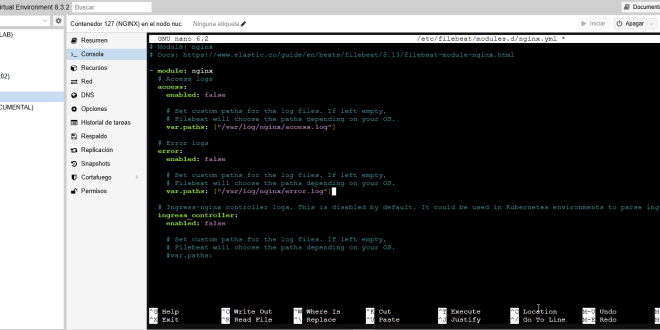
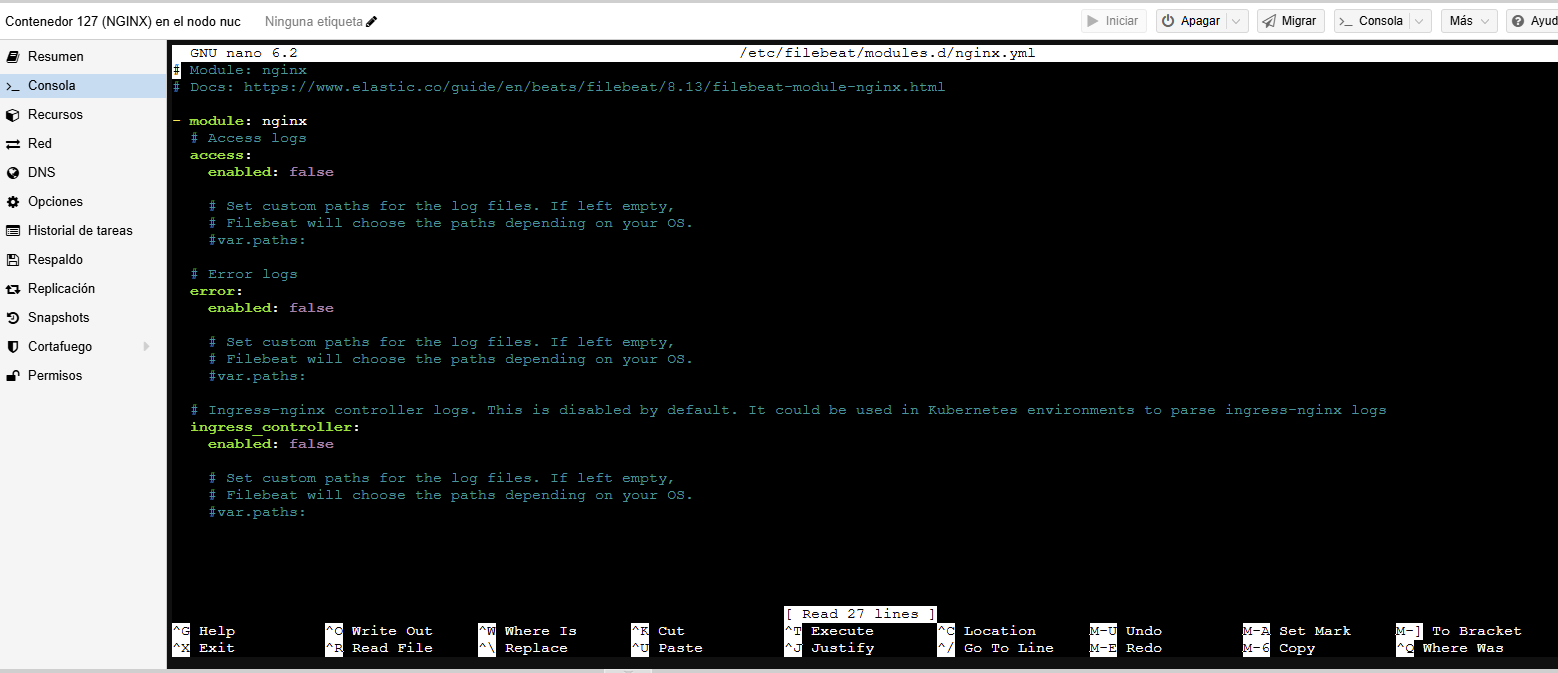
Configuramos las rutas de los logs para NGINX. Abrimos el módulo:
|
1 |
nano /etc/filebeat/modules.d/nginx.yml |
Y ajustamos:
|
1 2 3 4 5 6 7 |
- module: nginx access: enabled: true var.paths: ["/var/log/nginx/access.log"] error: enabled: true var.paths: ["/var/log/nginx/error.log"] |
Podéis revisar previamente si la ruta es correcta:
|
1 2 |
root@NGINX:~# ls /var/log/nginx/ access.log error.log |
Ahora tenemos que configurar la salida hacia ELK. Abrimos el fichero:
|
1 |
nano /etc/filebeat/filebeat.yml |
Según como queramos enviar los logs, lo podéis hacer de la siguiente forma:
|
1 2 3 4 5 6 7 8 9 10 |
### ENVIAR DIRECTAMENTE A TU SERVIDOR ELK COMO UN NAS output.elasticsearch: hosts: ["http://IP_DEL_NAS:9200"] ### ENVIAR CON LOGSTASH QUE ESCUCHA BAJO LA IP DEL NAS DONDE CORRE EL CONTENEDOR DOCKER output.logstash: hosts: ["IP_DEL_NAS:5044"] |
Modificamos también la línea de Kibana:
|
1 2 3 4 5 6 7 8 9 10 11 12 |
setup.kibana: # Kibana Host # Scheme and port can be left out and will be set to the default (http and 5601) # In case you specify and additional path, the scheme is required: http://localhost:5601/path # IPv6 addresses should always be defined as: https://[2001:db8::1]:5601 host: "nascasika.negu.local:5601" # Kibana Space ID # ID of the Kibana Space into which the dashboards should be loaded. By default, # the Default Space will be used. #space.id: |
Inicia Filebeat:
|
1 2 |
sudo systemctl start filebeat sudo systemctl enable filebeat |
Validamos que Filebeat está enviando desde el contenedor LXC:
|
1 2 3 4 5 6 7 8 9 10 11 |
root@NGINX:~/filebeat-8.12.2-darwin-x86_64# filebeat test output elasticsearch: http://nascasika.negu.local:9200... parse url... OK connection... parse host... OK dns lookup... OK addresses: 192.168.2.148 dial up... OK TLS... WARN secure connection disabled talk to server... OK version: 8.12.2 |
Si queréis ver los logs en tiempo real:
|
1 |
journalctl -u filebeat -f |
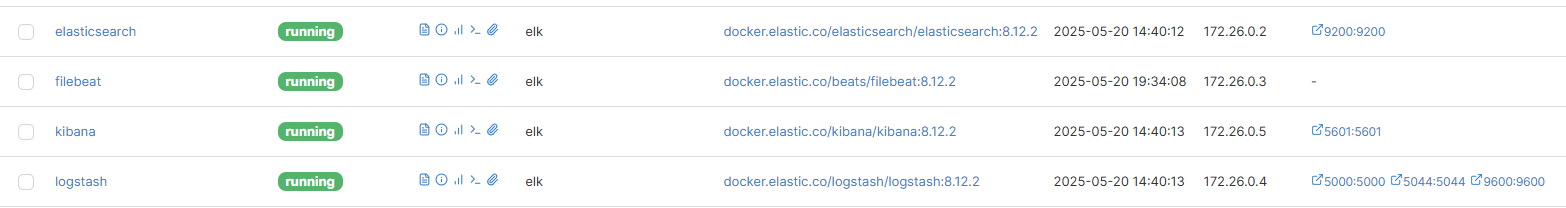
Reiniciamos el contenedor de Logstash (yo uso Portainer para gestionarlos):
Carga, esto es opcional, los dashboards de NGINX:
|
1 2 3 |
root@NGINX:~# filebeat setup --dashboards Loading dashboards (Kibana must be running and reachable) Loaded dashboards |
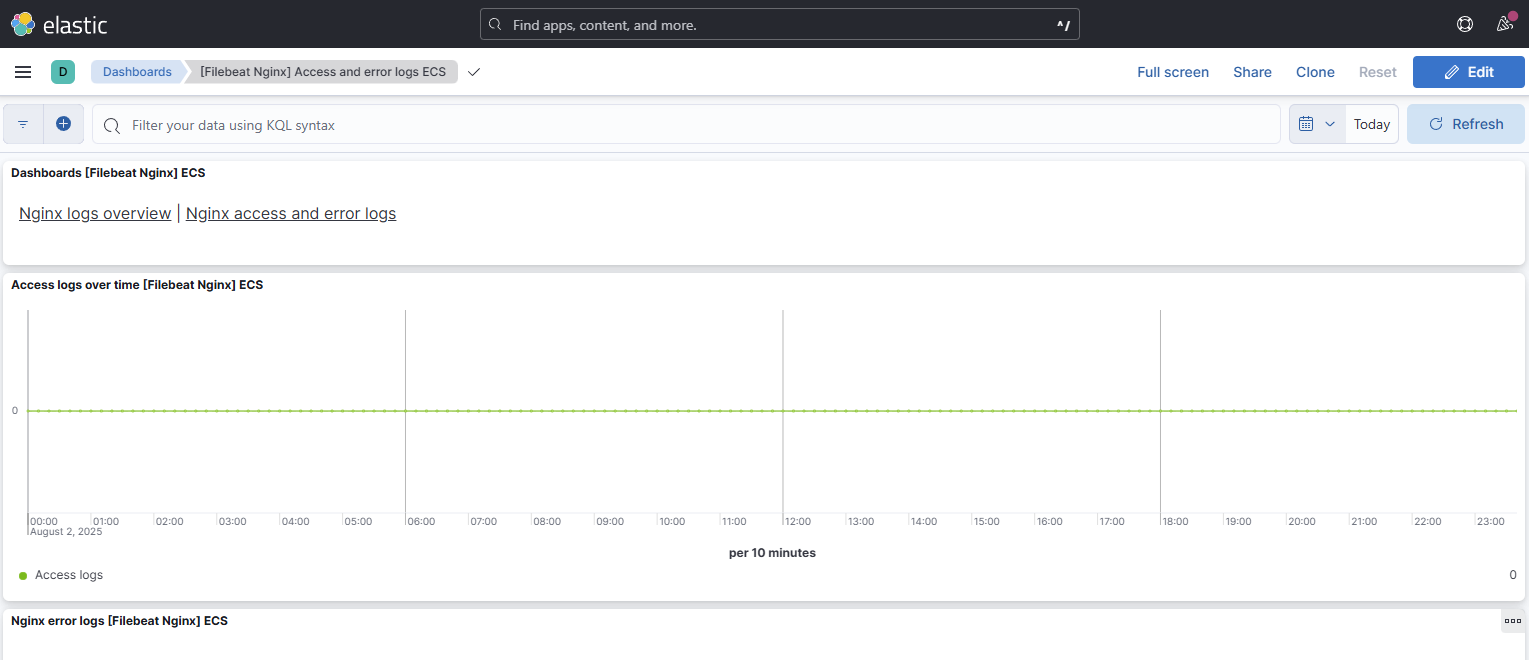
Revisamos Kibana que llegan logs:
|
1 |
Analytics → Dashboards → Filebeat NGINX module |
Entradas Curso ELK
- Curso ELK: Fundamentos del Stack ELK
- Curso ELK: Montar ELK Stack en Portainer y Docker Compose
- Curso ELK: Cómo en Enviar Logs de Windows 11
- Curso ELK: Cómo Enviar Logs de NGINX desde un contenedor LXC a ELK
- Curso ELK: Consultas Kibana (KQL) para Ciberseguridad
¿Te ha gustado la entrada SÍGUENOS EN TWITTER O INVITANOS A UN CAFE?